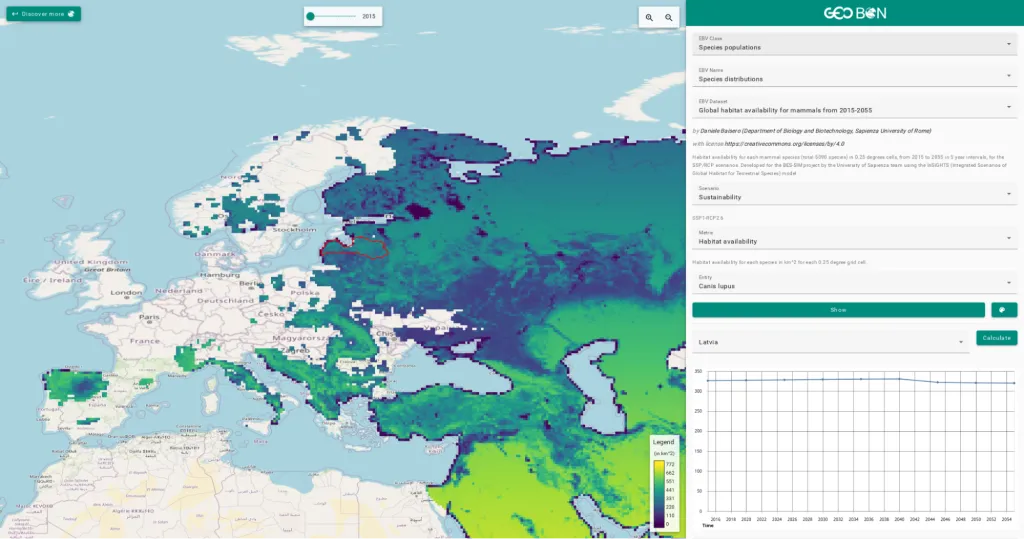
For the RESPECT project, we built a data portal based on our toolbox that makes various climate, weather, environmental and observational data available and analyzable. In addition, we connected the data portal to an existing infrastructure using single sign-on.
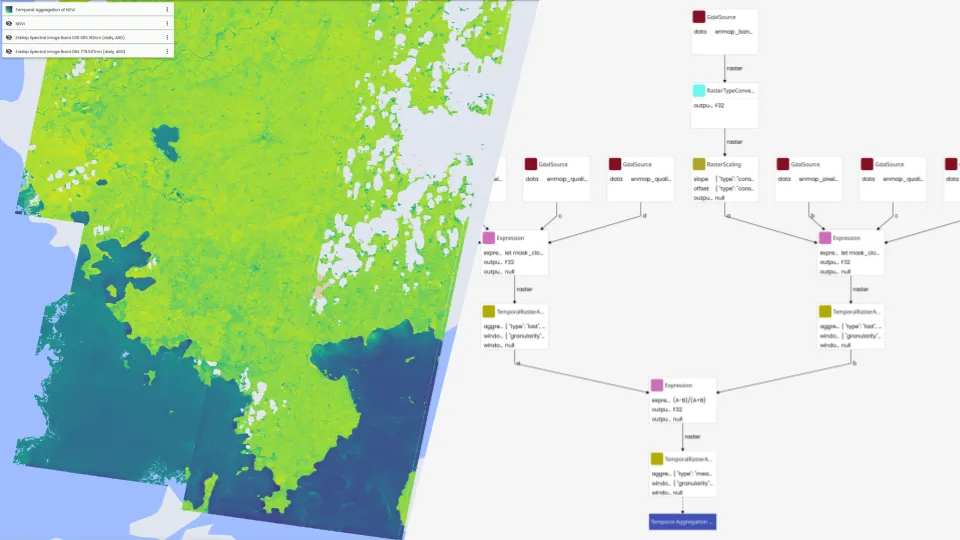
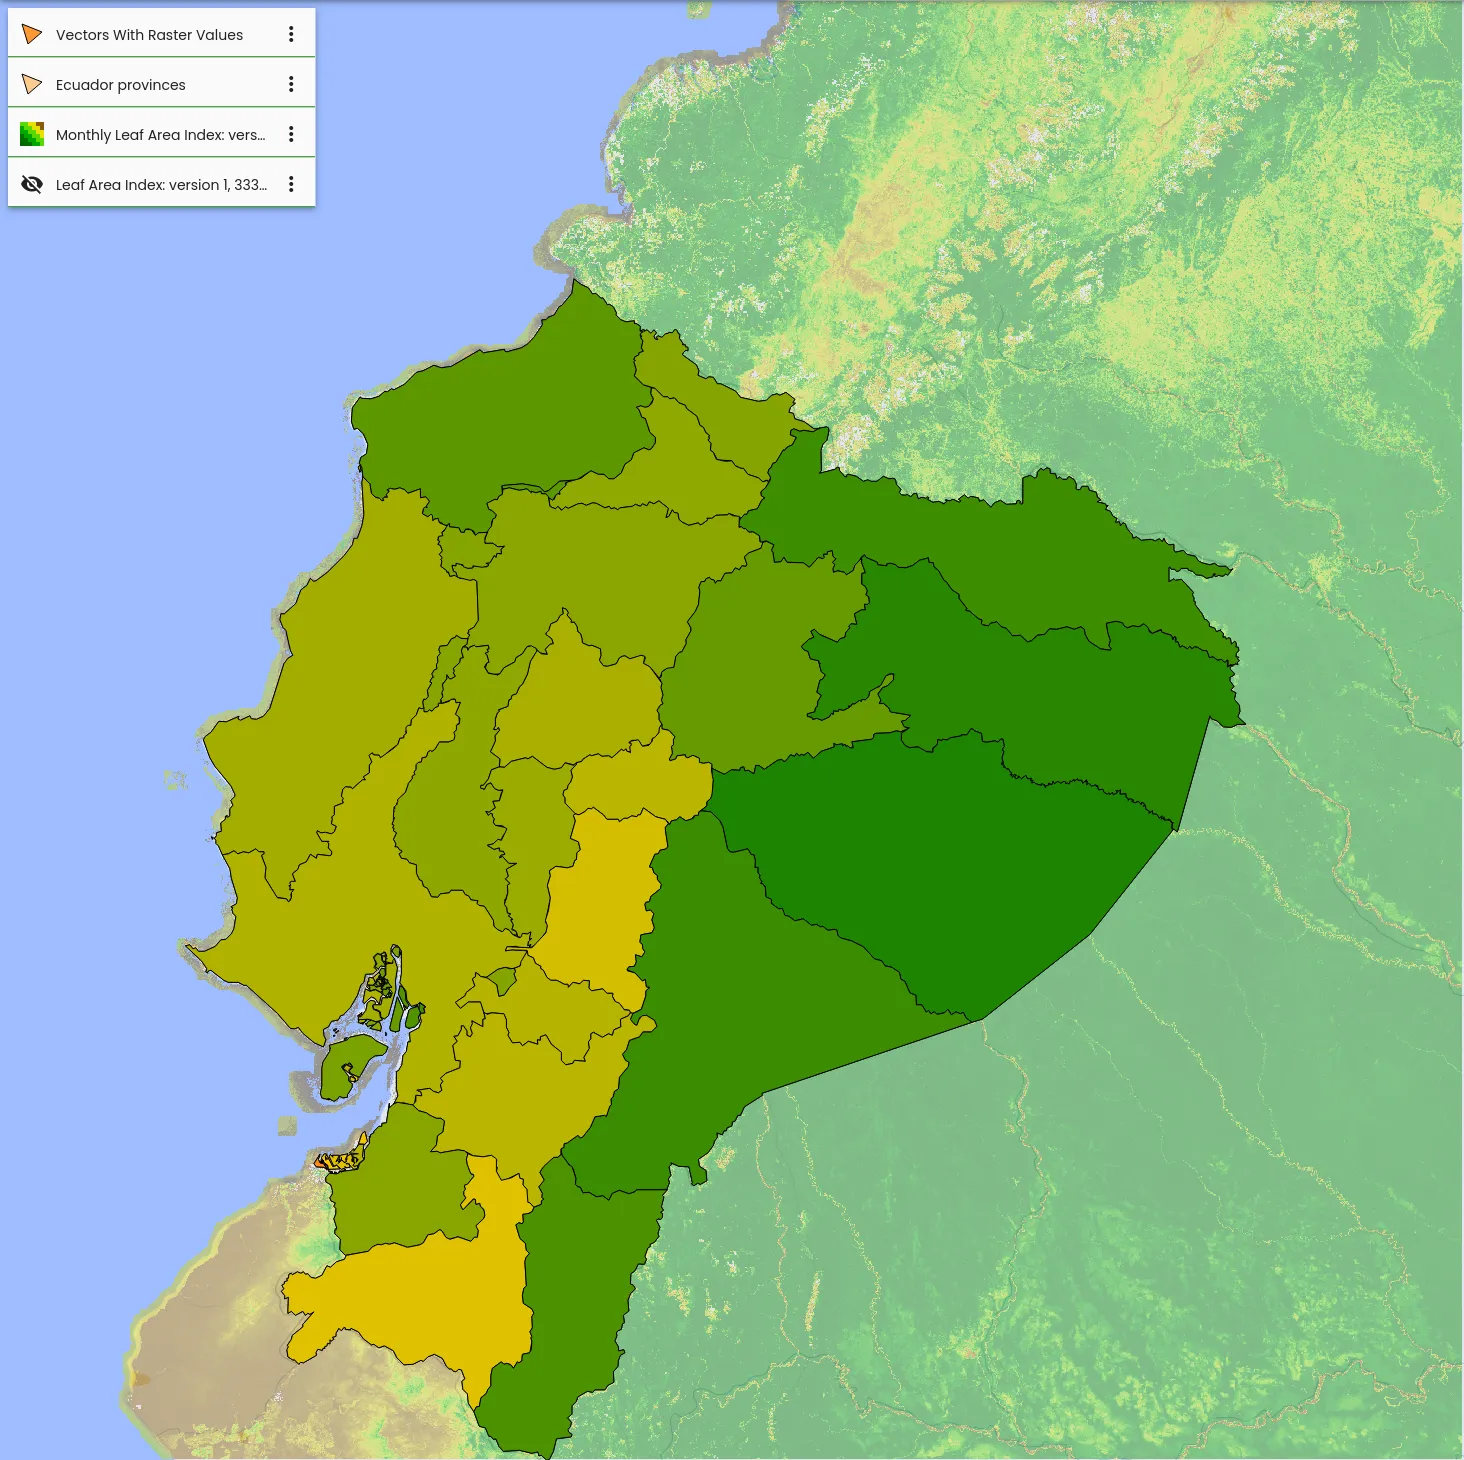
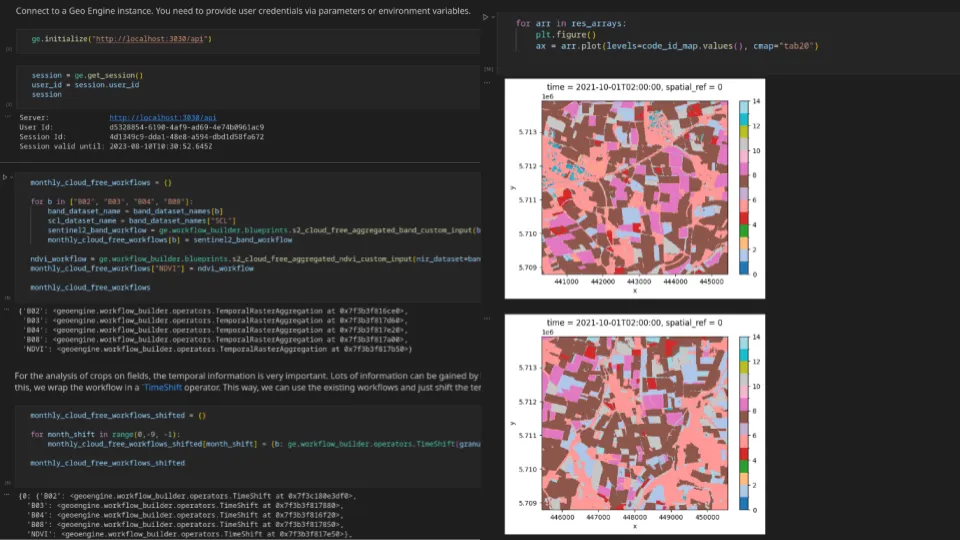
In the RESPECT project, researchers from different universities and institutes are working together to study environmental changes in the ecosystems of biodiversity hotspots in southern Ecuador. This requires solutions for both managing and processing geospatial data. Based on the Geo Engine toolbox, we have set up an interactive data portal with analysis functions. This allows researchers to access large data sets of climate and weather models via UI and API and use them for their work. In order to continue using existing user accounts and data, the data portal was linked to an existing project database with our single sign-on solution. The project works a lot with the mentioned model data, satellite data but also local observations. In order to combine these different data and to perform complex analysis, the data was connected to the Geo Engine. This gives the researchers access to a toolbox of operators. The operators can be combined into workflows to model processing pipelines. Processing that would otherwise be very complex can thus be easily implemented with little effort. Workflows can also be used to automate processing steps so that they do not have to be repeated. Such workflows are, for example, to remove clouds from satellite data or to adapt climate model data to the terrain in the mountains.
The EBV Analyzer is an interactive data portal for essential biodiversity variables. Here we have implemented, from existing Geo Engine building blocks, a data portal that is easy to use for biodiversity researchers and policy stakeholders. In a co-design process with the experts from GEO BON we developed visualization, analysis but also the integration of the complex EBV time series data.
GEO BON provides important biodiversity data in an interactive and easy-to-use web portal. Based on our toolbox, we implemented the interactive portal in this project suitable for biodiversity researchers and stakeholders from politics. Thus, we created the possibility to easily visualize the available time series data and to be able to analyze them for individual countries. The challenge was to directly integrate heterogeneous data from different researchers worldwide and make it globally available. We implemented an adapter for the Geo Engine for the specific EBV-4D data schema of GEO BON with multiple variables and time series. In addition, to enable interactive operation, the data is automatically indexed and made available. We seamlessly integrated the portal into the existing data environment.
We developed an interactive data portal for the German dragonfly research community. In a co-design process with the experts, we developed the presentation of dragonfly observation data as well as interactive analyses.
We developed a data portal for NFDI4Biodiversity that is easy to use for dragonfly experts and provides analyses of preferences regarding temperatures, precipitation and proximity to water bodies per dragonfly species. Based on existing Geo Engine building blocks, we created a target group oriented web based application. Invisible to users, the infrastructure runs in the cloud. The data is also loaded from the appropriate data infrastructures in the cloud. For NFDI4Biodiversity’s own data lake, which provides a data infrastructure for biodiversity data, a matching data access was implemented, which is reusable. The goal of the project is to be able to provide interactive data portals quickly and easily for a wide range of specialist communities. Based on the developed portal, any other subject data portals can now be created very quickly thanks to our modular approach. As part of the project, we have written and published a scientific paper on the topic (https://doi.org/10.18420/BTW2023-55).
We develop methods for integration and pipelines for processing data from DLR’s latest hyperspectral satellite: EnMap. Based on our Geo Engine, these are deployed in the cloud and used to develop ML models. In addition, there is a connection to Sentinel-2 data, which is used for joint processing with the EnMap data.
In the CropHype project, methods for monitoring vegetation and crops are being developed in a collaboration between SMEs and the university on the data from EnMap, DLR’s latest hyperspectral satellite. Here we support the provision of the data, the development of the processing pipeline and the deployment in the “EO-Lab” cloud. The Geo Engine offers many advantages in this project:
For an agricultural start-up, we provide a workflow that computes the time series of the mean monthly cloud-free NDVI from Sentinel-2. The time series is automatically extended on a monthly basis. The data comes from a STAC service and does itself not need to be stored. Using APIs, the data can be integrated directly into the customer’s processes.
We have implemented a processing pipeline for Sentinel-2 based NDVI vegetation indices. By using the Geo Engine, we can retrieve on-demand the latest Sentinel-2 data from the cloud via STAC. The retrieved data is further processed using an appropriate workflow. Operators for temporal aggregation to daily and monthly data products are used as well as cloud pixels are removed and formulas for vegetation indices are applied. The results are ready for further use and can be accessed directly via APIs. In addition to on-demand processing, automated tasks can also be launched to precalculate data products.
Clouds in satellite imagery carry information about the weather, but can also block the view of the actual target. We developed an AI model as well as a matching data pipeline to detect and mask clouds. The preparation of the Meteosat Second Generation time series data used as well as the AI training and application are implemented as a repeatable workflow.
Clouds are a phenomenon that plays an important role for most satellite images. While in Sentinel-2 time series, for example, one tries to combine images in such a way that the Earth’s surface is visible everywhere, one uses weather satellites to investigate, for example, how to classify clouds. For the classification of clouds we have implemented a complete AI pipeline including preprocessing. We trained on a time series of 10 years with images for every 15-minute interval. That’s over 35,000 images per year. The raw data was unpacked in the pipeline and prepared for various parameters. This data then flows into the connected ML framework Tensorflow to train a CNN model. The workflows that provide the training data can be used directly to apply the model for arbitrary time points. The trained model can be attached as an operator to the corresponding workflow. Thus, among other things, each new recording can be classified instantaneously.
The VAT system is a flexible web GIS for biodiversity researchers. It is part of the GFBio portal, which is operated within NFDI4BioDiversity, and provides data from German biodiversity archives and collections. In this portal, biodiversity researchers can visualize, explore and combine the data with environmental layers.
The VAT system is a web GIS built with the Geo Engine UI toolkit and connected to a Geo Engine backend. It is branded in the GFBio look-and-feel and is connected to both the portal search via an external data provider and the GFBio single sign-on service via the OpenID Connect protocol. The archive data is regularly harvested and then automatically available to biodiversity researchers. In addition to access via the web GIS, derived data from workflows can also be accessed via the Geo Engine Python interface using Jupyter notebooks. Geo Engine’s operator toolbox allows users to combine data or create graphs, such as histograms, over data. Data can also be viewed in tabular form. A highlight here is that linked media data is automatically displayed in an integrated viewer. This is useful if, for example, a photograph of a bone is linked to a find location.
Tasks such as regular reporting of regional weather and climate metrics, e.g. on water availability, often require a lot of manual work to process the weather data up and downstream. Here we have implemented a workflow that can completely automate this task.
Reporting of weather-dependent key figures for regions such as municipalities often requires a large amount of manual work. Here we have completely automated a workflow for such a case. This workflow can be applied as a blueprint to many other similar applications. First, we integrated data from ECMWF and national weather services into the Geo Engine. Using our Geo Engine toolbox, all necessary tasks are modeled as a workflow. This includes the aggregation to the reporting period and the extraction and calculation of key figures per region. Thanks to the Geo Engine, the results of the processes are directly accessible via APIs (e.g. OGC) and can thus be directly integrated as a service into further processes or provided as a dashboard.
We trained a pipeline for field crop detection with ML on Sentinel-2 data and the EuroCrops fields. The pipeline includes all steps from retrieving the data, pre-processing, temporal aggregation over months, to the ML framework in Python. Our Python library matching the Geo Engine is used here.
To train and apply ML for field crop classification, both satellite data, e.g. from Sentinel-2, and training data containing the information about the actual fruits grown on fields are needed. Especially for the classification of field crops, time-series are of great importance, since one can usually only distinguish them unambiguously by phenology, i.e. the development over time. Using the Geo Engine as a toolbox, we have not only automated data access, but also the combination and alignment of the different time series: The Sentinel-2 data is loaded from the cloud via the STAC protocol. Then the data, as well as the derived NDVI, are combined into monthly values. For each 12 months, the data is then used in combination with the field information to train the ML model. The data is processed as a data stream, this allows for arbitrarily large data sets to be used. Through our Python library we can feed different ML frameworks with data to train and apply models.